
Contents
- Step 1: KPI evaluation and reporting architecture
- Step 2: Building the HubSpot AI analytics dashboard
- Step 3: Setting up the Reporting Configuration
- Tasking & Process
This article covers the foundational setup required before any client enters the active reporting cycle. There are three steps: validating that the client's KPIs are actually reportable and building any missing measurement infrastructure, building the HubSpot AI dashboard and configuring Claude skill. All must be completed before the first report is produced.
Step 1: KPI evaluation and reporting architecture
Before building dashboards or pulling data, during the strategy build, the Strategist (or AM in collaboration with an Architect) must confirm that each of the client's KPIs can actually be reported on. A KPI that sounds good in a strategy deck but has no tracking behind it is not a KPI — it's a wish.
What to evaluate:
For each KPI in the client's strategy deck, answer the following:
- Is this KPI being tracked? Is there a source of truth — HubSpot, GA4, an ads platform, a CRM — capturing this data today?
- Is the data reliable? Has the tracking been verified, or is there a known gap (e.g., pre-GTM installation, missing conversion events, attribution issues)?
- Is the data accessible? Can Vye pull this data into a report or dashboard, or does it live in a system we don't have access to?
- Is the benchmark or goal defined? A KPI without a target cannot be evaluated for performance.
Looking for more tips for setting solid KPIs?
→Check out How do we set KPIs?
Building missing architecture
If a KPI requires infrastructure that hasn't been built yet, that work must be scoped and completed before the first reporting cycle — not worked around. This work will be outlined by the Strategist and passed to PMs for tasking out to Architects. Common build-outs include:
- GA4 conversion event setup
- HubSpot lifecycle stage configuration
- Deal pipeline and revenue tracking in HubSpot
- UTM parameter frameworks
- Lead source attribution logic
- Form-to-CRM submission mapping
Revisiting KPIs
If a KPI cannot be made reportable within a reasonable timeframe — or the cost of tracking it outweighs the value — escalate to the AM to revisit it with the client. Propose a reportable proxy and document the substitution in the strategy deck. Never silently omit a KPI from reporting without acknowledging the gap.
Step 2: Building the HubSpot AI analytics dashboard
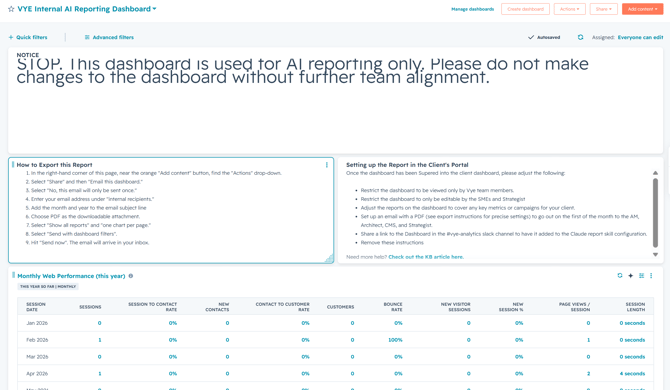
Every client receiving Vye's AI-powered reporting process gets a dedicated HubSpot AI analytics dashboard. This dashboard is the operational hub for data collection and AI input.
Access & permissions
Important: This dashboard should only ever be edited by the strategist or architect assigned to the account. AMs and PMs may request edit access as needed, but edits outside of the strategist/architect scope should be discussed before being made. This is done to protect integrity of data for AI reading.
Template and setup
A template for the HubSpot AI analytics dashboard lives in the Vye demo portal and can be exported via Supered and duplicated into the client's portal.
To set up the dashboard for a new client:
-
Access the template in the Vye demo portal >>LINK<<
-
Export via Supered and import into the client's HubSpot portal
-
Rename the dashboard following the convention: Vye AI Analytics
-
Set visibility to private (Vye team only)
- Assign the strategist as the owner
- Grant editor access to the account architect and a back-up architect
- Grant view-only access to the AM, PM and CMM on the account.
- Configure reports within the dashboard
- Schedule a PDF email to be sent to the strategist and AM on the account
Best practices for AI reporting dashboards
Because this dashboard feeds an AI reporting process — not a human reading charts in real time — how you build the reports matters as much as what you build. Follow these standards on every account.
Use tables over charts wherever possible: Charts are designed for human pattern recognition. The AI tool reads data, not visuals. Tables are almost always preferable because they surface the actual numbers clearly and reduce the risk of the AI misreading a trend from a visualization. Use bar or line charts only when a table genuinely cannot communicate the data — and when you do, make sure the underlying data values are still accessible.
Balance report count against portal limits: HubSpot portals have a finite number of reports available depending on the client's subscription tier. Before building new reports, audit what already exists in the portal. Where possible, repurpose or consolidate existing reports rather than creating new ones. If you are approaching a portal's report limit, flag it before adding more — decisions about what to prioritize or archive should be made deliberately, not discovered at the point of failure.
Always show trend data: The AI tool needs to see movement, not just a snapshot. For every key metric, the dashboard should make the delta visible. Two examples:
-
Month-over-month columns within a single report — a table that shows the current period and prior period side by side so the change is explicit
-
Two separate reports for the same metric — one scoped to the current reporting period and one scoped to the previous reporting period, allowing the AI to calculate the delta itself
Either approach works. What doesn't work is a single-period report with no comparison point. If the AI can't see the trend, it can't produce meaningful analysis.
Start with the core metrics, then layer in client-specific additions: The baseline dashboard should always cover the following — these are the metrics that anchor every client's reporting regardless of industry or focus:
- Website traffic by source
- New contacts by source
- Blog views
- Lead generation/forms
- Lead progression (subscriber → lead → MQL → SQL → opportunity → customer)
- Revenue information and deal data where pipeline tracking is in place
From there, add what is meaningful for that specific client. Use the report configuration document (Step 3) to document what has been added and why.
Do not rely on list counts as a long-term metric: If a key lead or conversion metric only exists as a HubSpot list, treat that as a gap. List counts are static, lack historical context, can’t be trended, and are vulnerable to logic changes. Before using a list count on the dashboard, confirm that proper architecture (lifecycle stage, deal stage, custom property, conversion event) can be built to track it and build as a report. Don’t proceed with that metric until the architecture is in place or you’ve documented a decision to defer. Flag this to the architect and AM.
Expand report sizes so all key data is visible (or at least prioritized): Because Claude will rely on exports and PDFs, we will need to make sure as much data as possible will be included in those exported documents.
Remove irrelevant metrics from standard reports: Reports on web pages, web traffic, new contacts, etc. may have metrics available like session-to-customer or new customers. If these are not applicable, remove from the report, so prevent Claude from confusing a true 0 wil null.
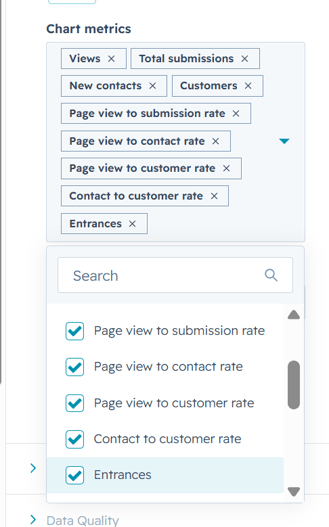
Clone reports that are shared or actively filtered elsewhere in the portal: Reports in HubSpot are not chained to a single dashboard — the same report can live on multiple dashboards simultaneously, and any editor with access can modify it from anywhere it appears. If a report you want to include on the AI analytics dashboard is already living on another dashboard, is frequently filtered or adjusted by the client or other team members, or is used in a context where its configuration might reasonably change, do not use that shared report. Clone it.
The goal is a set of stable reports that will not be inadvertently changed by activity elsewhere in the portal. Treat the AI analytics dashboard as a protected environment — what lives here should only ever change when the strategist or architect makes a deliberate decision to change it.
A few additional things to check before calling the dashboard complete:
- Every report has a clear, descriptive name, so the AI can identify what it contains at a glance. This is especially important when running parallel reports for trend comparison — if two reports cover the same metric for different periods, the time frame in the name is the only thing distinguishing them.
- All reports are scoped to the correct date range defaults and will update automatically with each reporting cycle — no manual date adjustments should be required each month.
- There are no reports pulling from test contacts, internal team members, or sandbox data — verify exclusion filters are in place.
Remember: We are no longer using "Vye" naming conventions in HubSpot assets unless explicitly required.
Step 3: Setting Up the Claude Configuration
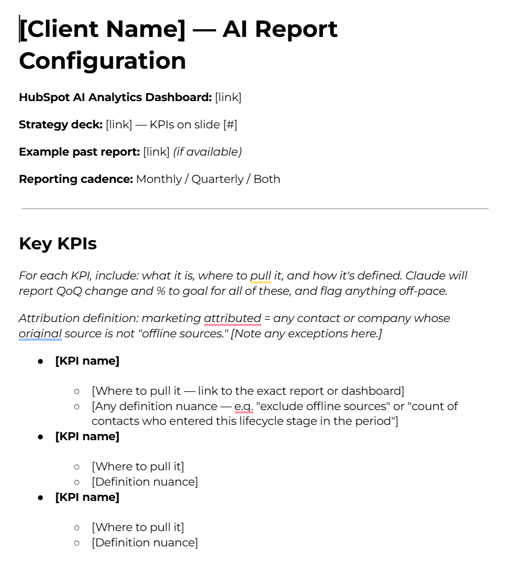
The AI Report Configuration doc tells Claude exactly how to build a monthly or quarterly marketing insights report for a specific client. A good config doc means Claude can pull the right data, interpret it correctly, flag the right things, and format the output consistently — without you having to re-explain everything each time.
Think of it as a standing brief. Write it once, update it as things change.
📁 Link to report configuration folder
📝Link to report configuration document template
The configuration document will be prepared as each client is onboarded to Vye and as strategies are completed with new KPIs. These documents are also updated as client priorities and reporting needs change.
Here's what each config document should include:
-
Client basics — HubSpot dashboard link, strategy deck link (with KPI slide number), past report reference, and reporting cadence
-
Primary KPIs — what to track, where to pull each one, how it's defined, and attribution rules
-
Supporting metrics — web traffic, social, blog, email, paid media, SEO/AEO, and anything client-specific
-
Active campaigns — links and pull instructions for every HubSpot campaign being reported on
-
Report format — length, font, file type, structure, and tone guidance
-
Known gaps & notes — a date-stamped log of caveats, WIP items, and anything temporarily affecting the data
Tasking & Process
- When new clients are onboarded with Vye, the Architect will build the AI analytics dashboard in HubSpot and preliminary report configurations.
- When the deck is finalized and past to Architect for review, they will update the AI analytics dashboard and reporting configurations as necessary.